Creative
Visual Storytelling
Visual Storytelling — Maps, Charts & Animations
Focus: Explaining Complex Topics Through Visual Media
What I Did
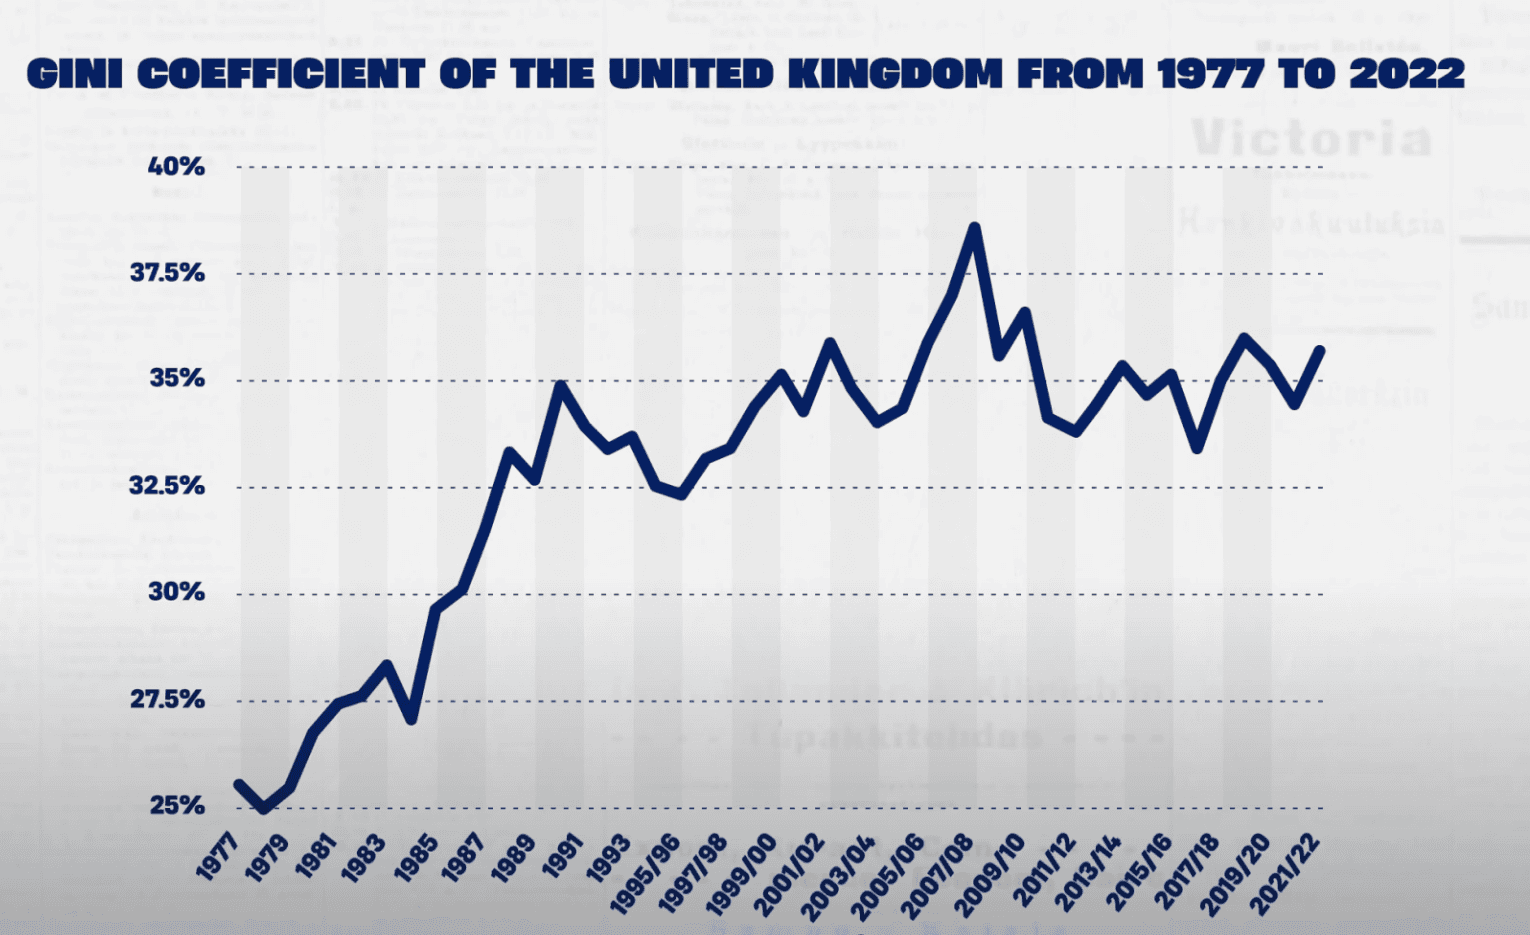
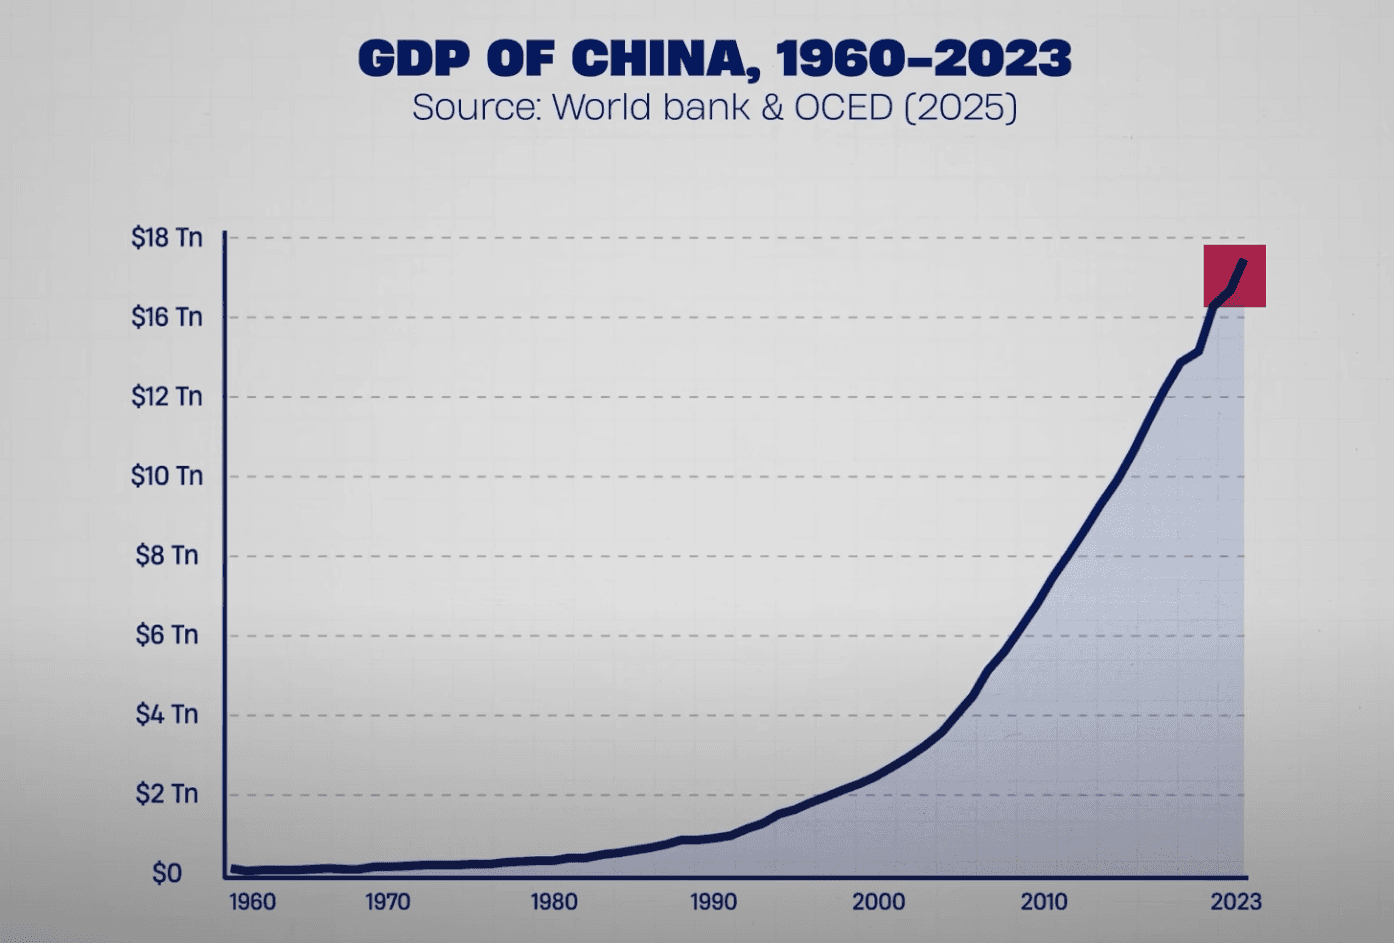
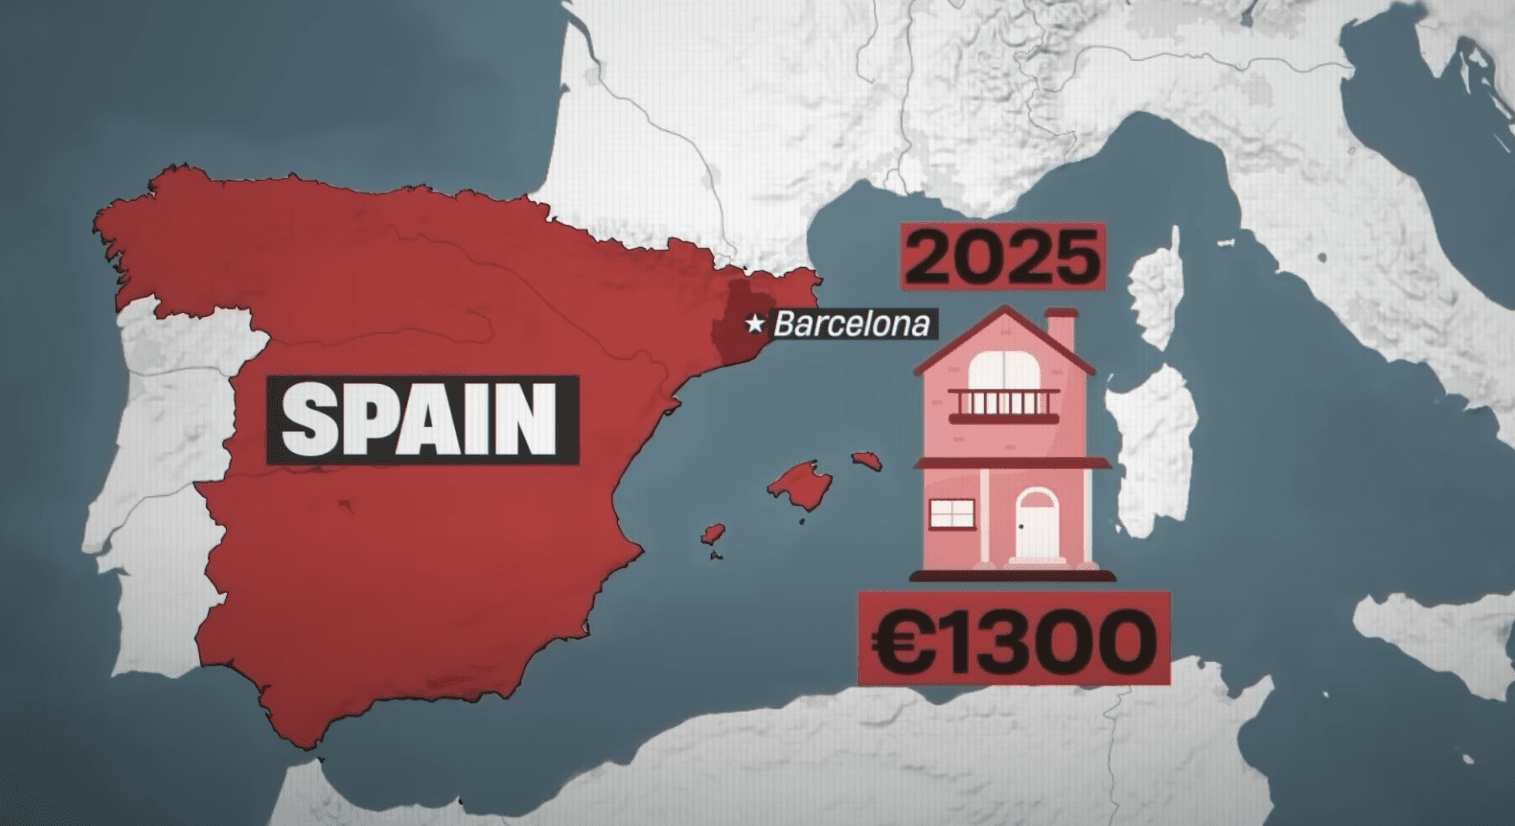
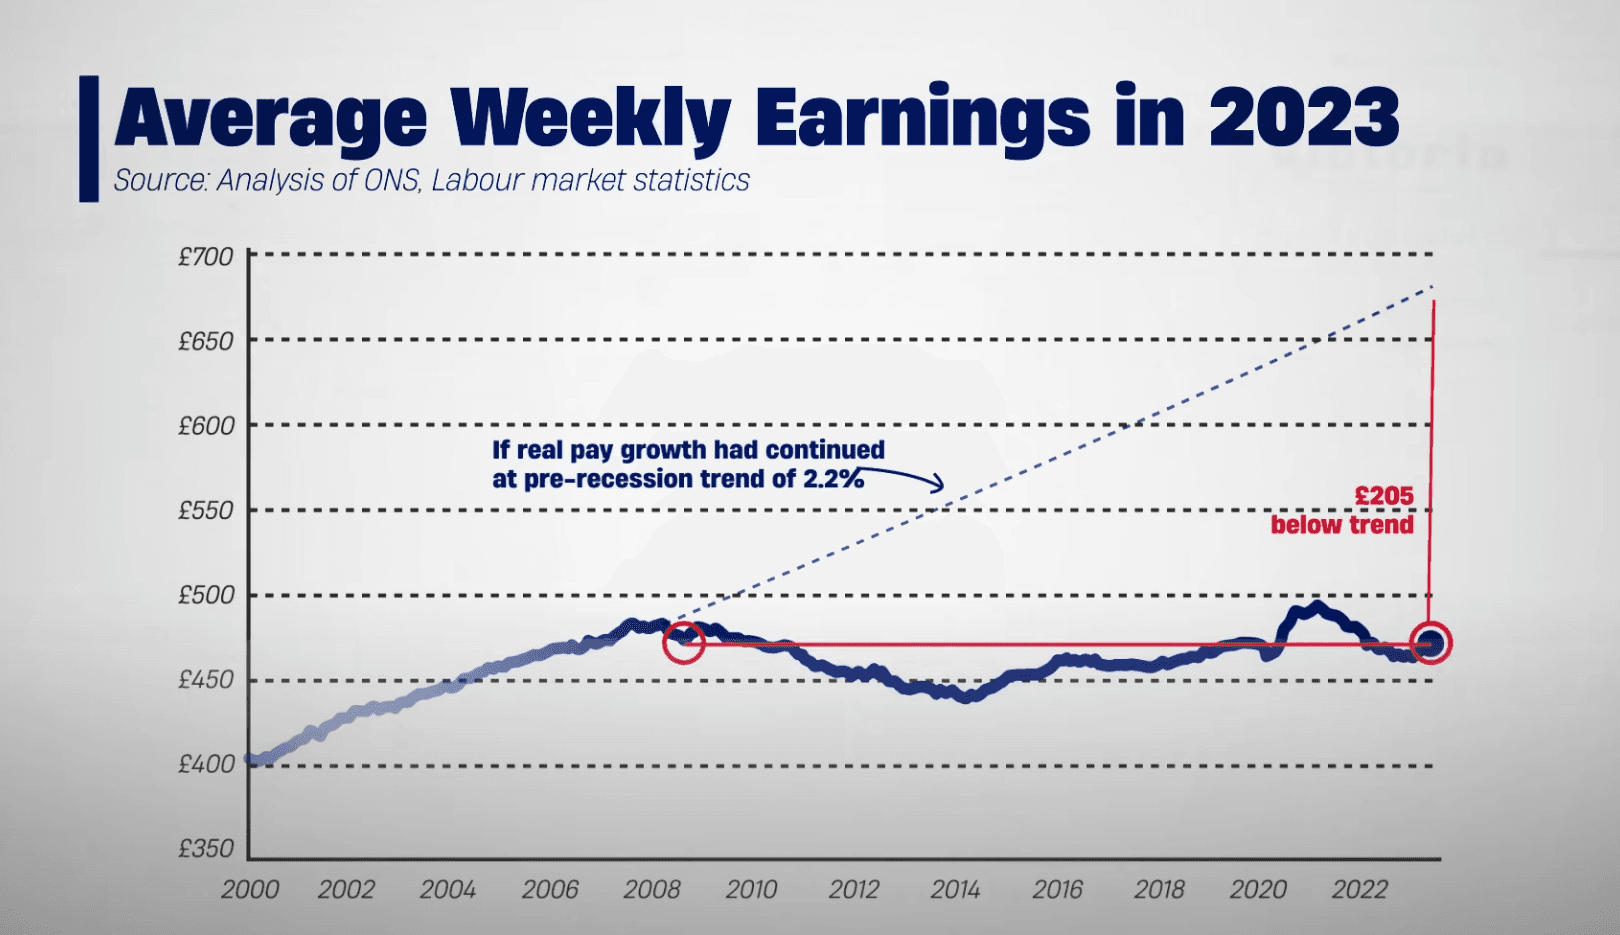
Created maps, data charts, and animated visuals to help explain complex ideas in geopolitics, economics, and social issues
Turned raw data and research into clear, engaging visuals for videos and digital content
Used design to show patterns, comparisons, and global trends that were easy for viewers to understand
Where It Was Used
Educational YouTube videos, academic presentations, and social media posts
Topics included trade routes, migration, income inequality, and global conflicts
Skills Gained
Data visualization and storytelling through graphics
Tools like After Effects, Illustrator, Canva, and Google Charts
Presenting complex info in a way that’s visually powerful and accessible